Today’s Analytics and Business Intelligence Platforms (ABI platforms) emphasize visual self-service for end users, augmented by AI to deliver automated insights. The focus of augmentation is shifting from the analyst to the trader. Automated insights must be statistically relevant, but they must also be relevant in the context of the trader’s goals, their workflow, and the actions they need to take based on the data.
About Microsoft PowerBI
Power BI is an interactive data visualization software developed by Microsoft, focusing primarily on business intelligence. It is part of the Microsoft Power Platform. Power BI is a collection of software services, apps, and connectors that work together to turn unrelated data sources into coherent, visually immersive, and interactive insights. Data may be input by reading directly from a database, webpage, or structured files such as spreadsheets.
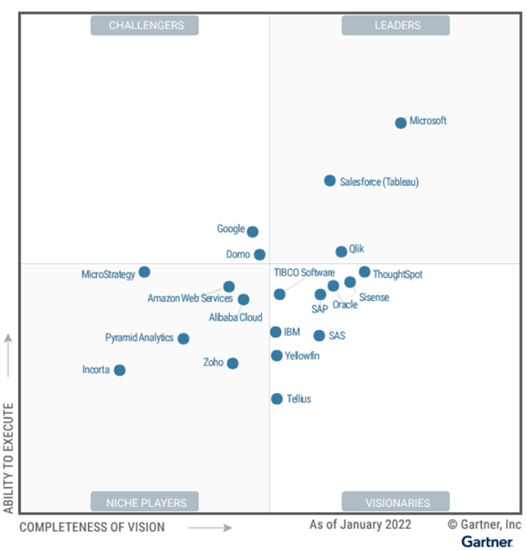
Quadrant for Analytics and Business Intelligence Platforms, Source: Gartner (March 2022)
Power BI provides cloud-based business intelligence services, known as “Power BI Services,” and a desktop-based interface called “Power BI Desktop.” It offers data warehouse capabilities, including data preparation, discovery, and interactive dashboards.
Microsoft is the clear leader in Gartner’s Quadrant for Analytics and Business Intelligence Platforms Source (March 2022). It has massive market reach and momentum through Office 365 and a comprehensive, visionary product roadmap. Microsoft solutions offer data preparation, visual-based discovery, interactive dashboards, and augmented analytics.
Functionality in Microsoft Power BI includes the following five critical capabilities:
- Security – This enables platform security, administering users, auditing platform access, and authentication
- Cloud – The ability to build, deploy and manage data & analytics in the cloud
- Machine learning – Automatically generating insights for end-users
- Data visualization – Support for highly interactive dashboards and the exploration of data through the manipulation of chart images
- Reporting – This capability provides pixel-perfect, parameterized, and paginated reports that can be scheduled and burst to a large user
Microsoft aligns Power BI closely with Dynamics 365, Office 365, Microsoft Teams, Excel, and SharePoint. As many customers turn to Microsoft Teams for remote work collaboration, the ability to access Power BI and now “goals” within the same Teams interface is an effective integration for business users.
Power BI is primarily deployed as a SaaS option running in Azure but offers an available on-premises opportunity in Power BI Report Server.
DycoTrade & Microsoft Power BI for commodity trade reporting and business intelligence
DycoTrade is fully embedded inside Microsoft Dynamics 365 for Finance and Supply Chain Management, which means it’s an integrated solution. DycoTrade CTRM is entirely embedded, indicating that we are reusing parts of the standard Microsoft system, such as the accounting system, the inventory system, and the human resource system.
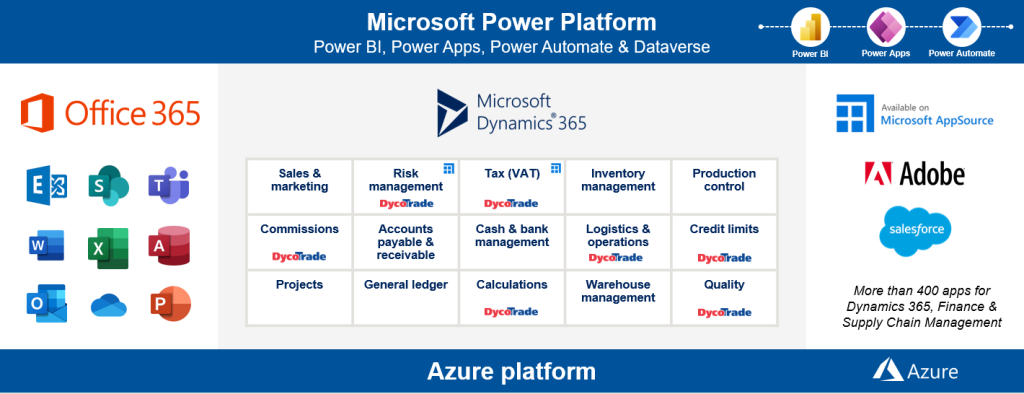
Microsoft Power Platform
Microsoft Power Platform allows users to compose low-code or no-code automation workflows and applications quickly. This blend of capabilities is helping to expand the vision for analytics beyond simply delivering datasets and presenting dashboards to having enriched contextualized insights, refocusing attention on decision-making processes, and ultimately taking actions that will provide business value.
Microsoft PowerBI & DycoTrade
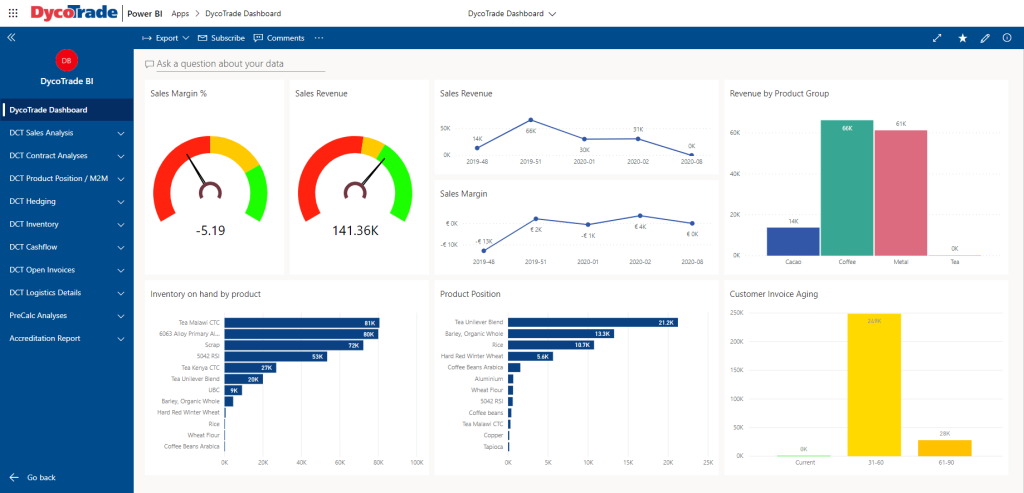
For its end-to-end Commodity Trade and Risk Management solution DycoTrade gets the most out of Power BI. Reporting tool connects to any external data sources to pull in data and report on the trades coming from a DycoTrade data lake connected to the Microsoft Dynamics 365 solutions.
DycoTrade CTRM comes with a standard set of Commodity Trading reports, covering about 80% of all our customer’s needs out of the box. The last 20% is always customized to the customer’s needs during the implementation. These customizations could be adding a filter, adding a different column to a report, or adding other graphics such as charts to the words.
Starting your implementation with an out-of-the-box advanced Position Management report, Mark to Market reporting, and Forex positions gives you a swift ROI on DycoTrade, powered by Microsoft Dynamics 365 Finance & Supply Chain Management.
DycoTrade CTRM is a leading solution that demonstrates a solid understanding of the key product capabilities and the commitment to customer success that Commodity Trading companies these days demand.
The topic of our next LinkedIn Newsletter: “How comprehensive is your long-term sustainability strategy?”
Sustainability Solutions
From our customers, we hear more and more that sustainability is rapidly becoming a factor in commodity trading. Although this mainly started with soft commodities, all other segments quickly followed.
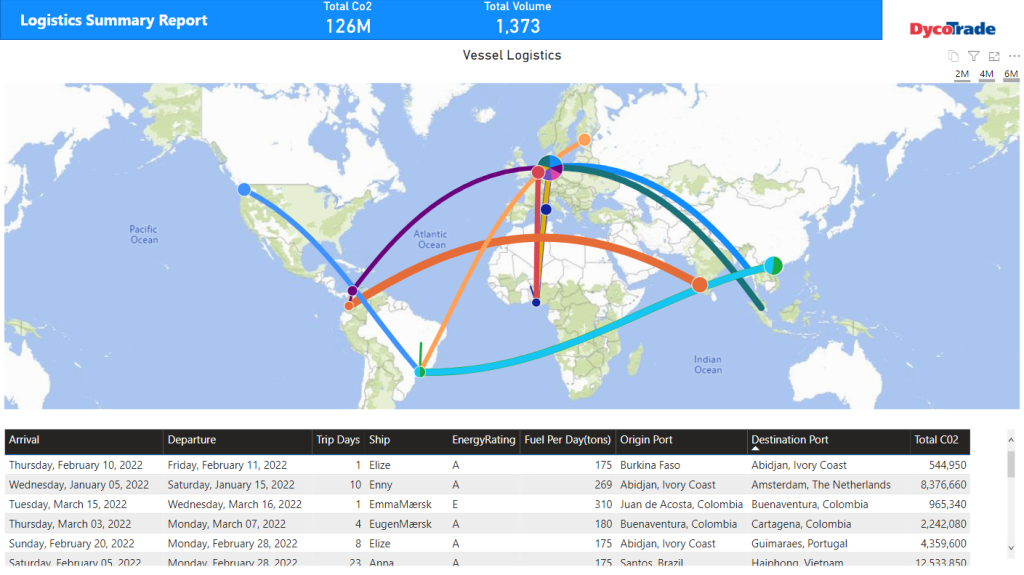
We see it as essential for traders to be aware of, for instance, the CO2 footprint of the contract they are working on. How does this fit into their company’s CO2 targets, and which route can best be chosen to protect our environment?
In our next article, we will be talking about how you can use DycoTrade & Microsoft BI to improve your:
- CO2 emission by choosing the best routes based on your CO2 data
- Fair Trade by keeping track of the validity of your certificates
If you want to stay on top of the newest Microsoft & DycoTrade CTRM solutions, click here to subscribe to our monthly LinkedIn Newsletter! Or contact us for more information.